
E-commerce scale-up
One live source of truth across fragmented e-commerce data, plus automated, review-ready KPI reports.
 Europe·Analytics & reporting platform
Live source of truth
Reporting
PDF · Excel · PPT
Output
Validated & deduplicated
Data quality
The challenge
The numbers were everywhere and never on time. Revenue lived in the web shop, fees in the marketplaces, costs in the warehouse system, spend in the ad platforms, and the truth somewhere in finance tooling. Every week, staff exported separate spreadsheets and stitched revenue, margin, inventory and customer figures together by hand. By the time management read a report the numbers were stale, and the things you most want to catch early, falling conversion, low stock, a marketplace feed gone quiet, surfaced too late to act on. On top of that, every recurring report for management, marketing, finance and operations ran through its own manual process, with its own definition of what a KPI even meant. We built two systems to fix both halves: the data and the reporting.
The analysis
The data sat in six-plus systems that never agreed. Each source had its own product IDs, timestamps, currencies and definition of revenue, so nothing lined up without manual cleanup.
Weekly spreadsheets were always a snapshot of the past. By the time a report reached management the figures had moved, and anomalies were caught days too late.
Every department defined its KPIs differently. Marketing, finance and operations each built reports their own way, so the same metric meant different things in different decks.
Trustworthy data was the hardest part. Marketplace settlements arrive late, refunds land days later, and API limits or outages leave gaps, so a real commercial change is easy to confuse with a technical data problem.
What we built

Analytics dashboard
A fully integrated dashboard that continuously collects and processes data from every system into one live source of truth, combining high-level financial reporting with operational detail in finance and logistics.
5 parts
- Continuously pulls orders, refunds, platform fees, shipping costs, stock positions and customer activity, then normalises it all into a shared data model.
- A central KPI engine computes revenue, gross margin, new customers, AOV, churn and active users; users filter by date range and source, compare to the previous period and inspect trends.
- High-level finance plus operational depth: revenue over time, channel split across website, Shopify, Amazon and bol.com, and product and regional views.
- A configurable alert centre flags revenue declines, critical stock, high churn, delayed sources and sub-target margins, plus goals, notes, reports and user management.
- The hard part, trustworthy data: validation, deduplication, retry logic, historical recalculation and source-health monitoring separate a real commercial change from a technical gap.
KPI tracking & reporting tool
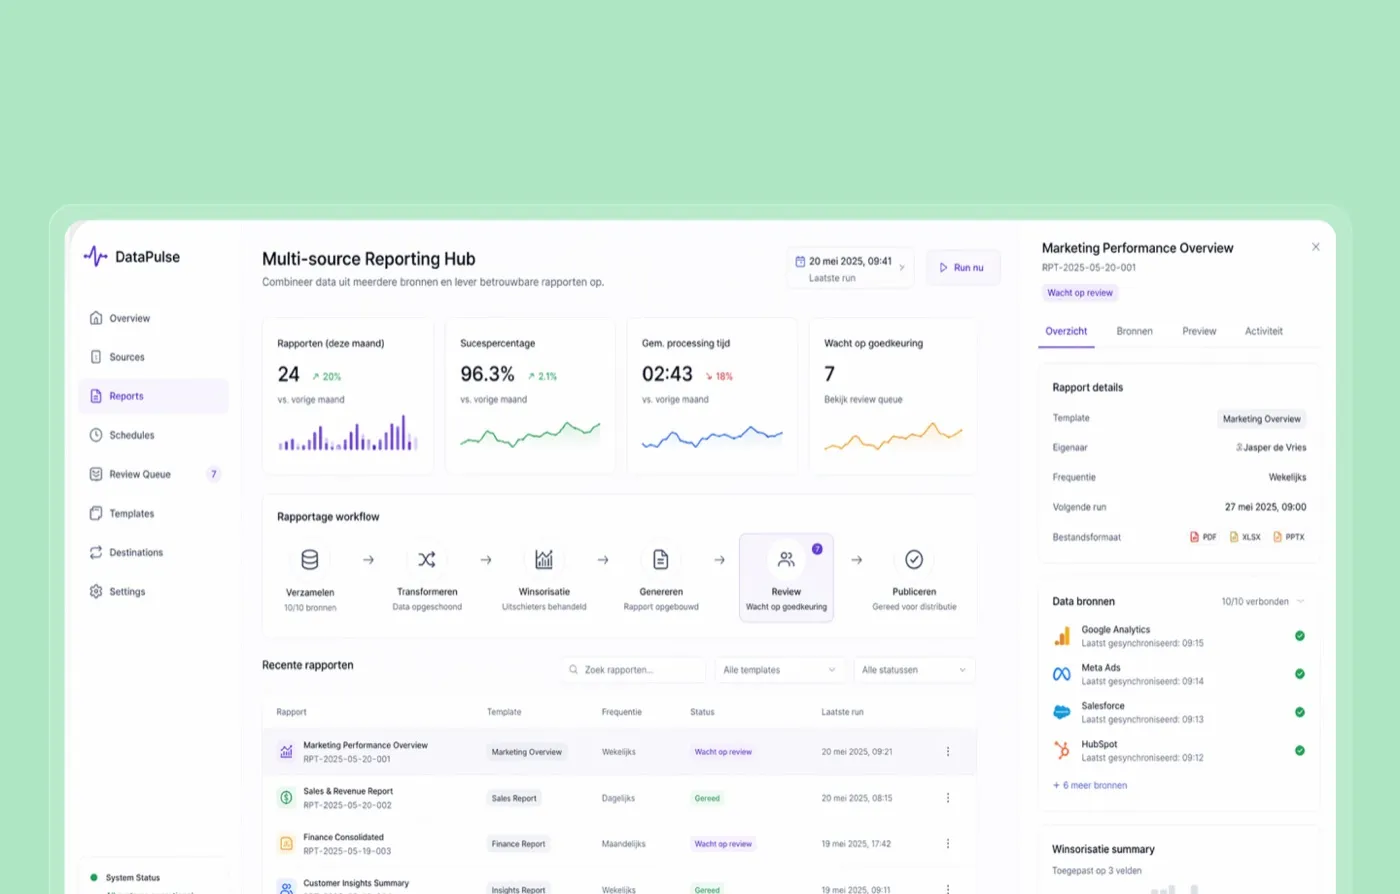
A multi-source reporting hub that automates recurring reports end to end while keeping a human review step, so management, marketing, finance and operations all work from the same definitions.
5 parts
- Admins connect and monitor each source (Google Analytics, Meta Ads, CRM, web shop, finance software, spreadsheets), map fields to a shared model and define each department's calculations.
- On schedule the platform collects, transforms and applies controlled winsorisation to outliers, then feeds clean data into reusable templates for marketing, sales and revenue, finance, customer insights and operational KPIs.
- Each template defines its owner, frequency, sources, visualisations and outputs; reports run weekly, monthly or on demand and export to PDF, Excel or PowerPoint.
- A live workflow shows collection, transformation, visualisation, generation, review and publication; finished reports land in a review queue to inspect figures, see sources and compare to prior periods before anyone approves or returns them.
- Reliability work, source checks, queued processing, versioning, permission controls and detailed logs, keeps output reproducible and auditable: no duplicate publishes after a retry, and generated files stay visually consistent.
The blueprint
- 1Connect sources
- 2Normalise
- 3KPI engine
- 4Validate & dedupe
- 5Visualise
- 6Review & publish
Results
Reporting
Live source of truth
Replaced manual weekly Excel work with one dashboard everyone reads.
Output
PDF · Excel · PPT
Automated, review-ready reports, approved by a human before they go out.
Data quality
Validated & deduplicated
Real changes and technical gaps are clearly separated, not guessed at.
Tech & tools
Part of our service: Webshops
Why teams build with TopDevs
- Fixed price, agreed up front
- 100% code ownership, no lock-in
- Prototypes in days, live in weeks
- Modern, AI-native & secure tech
Ready to build something that actually works?
Book a no-obligation call. We'll look at where the biggest win sits — fixed price, your code, no lock-in.
Start your own projectMore case studies
Bag of Dreams

Games
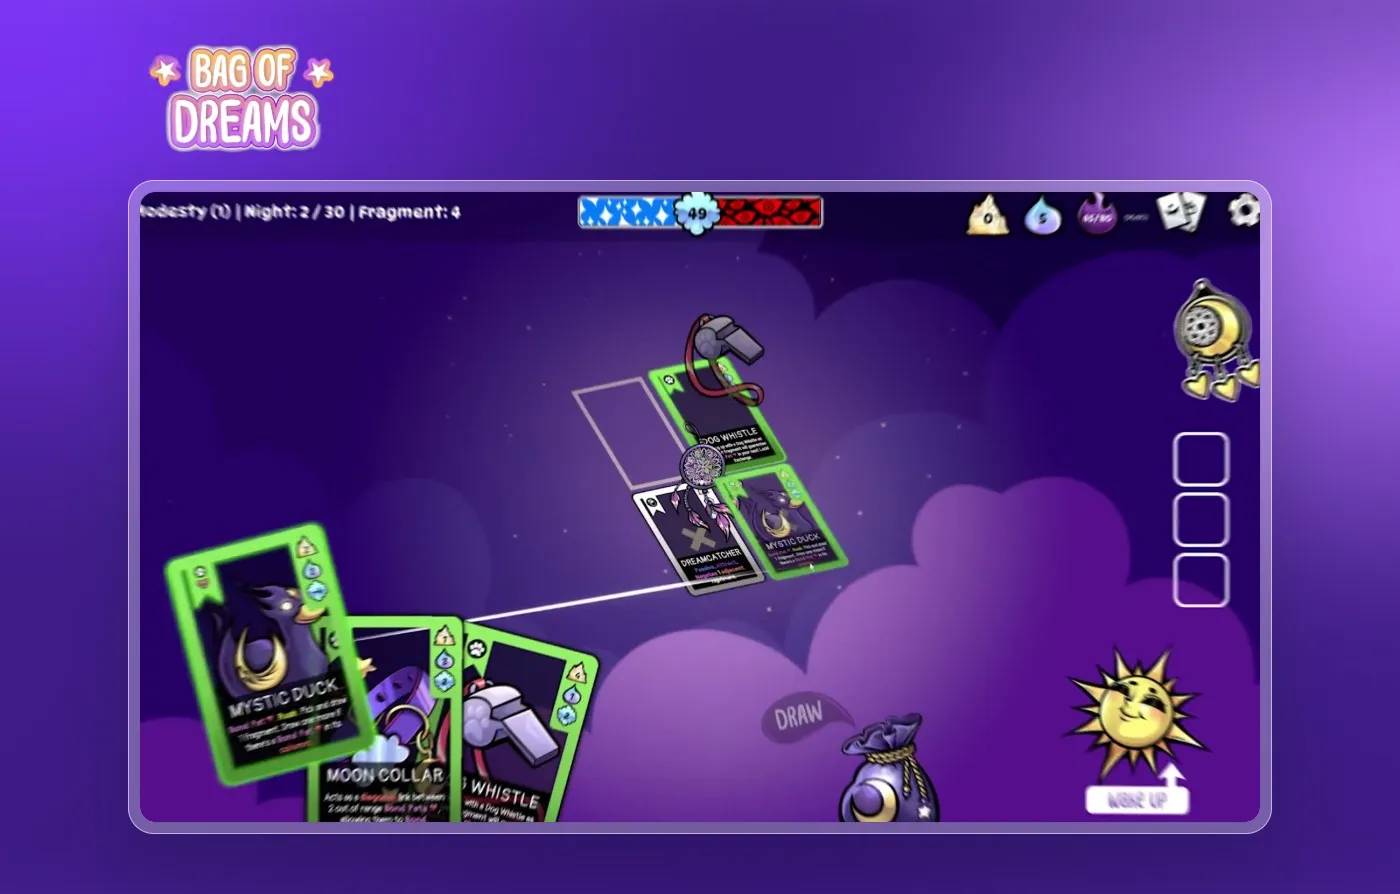
Bag of Dreams: a cozy roguelike card game, built from concept to release on Steam by two of the owners of TopDevs.
Roguelite deckbuilder
Genre
March 2026
Release

Castle of Blackwater
Games / Web3
Castle of Blackwater: a multiplayer social deduction game, built from first sketch to worldwide launch on Steam by two of the owners of TopDevs.
Up to 10
Players per round
91% positive
Steam reviews

Fair Play Collective
Web3 gaming
Fair Play Collective: logo, identity, design and an animated website for a partnership in Web3 gaming.
Brand, design and site
Made
Home, blog and article
Pages